


Published: Monday, 21th October 2024
Comparedoo.com welcomes you to explore the detailed comparison between China and United States.
Dive in and compare them across different aspects like cost of living, standard of living, geography, demographics, environment, society, economy, health factors and many more.
Enjoy exploring!


 Indicators  | China  | United States  |
|---|---|---|
Official Name  | People's Republic of China | United States of America |
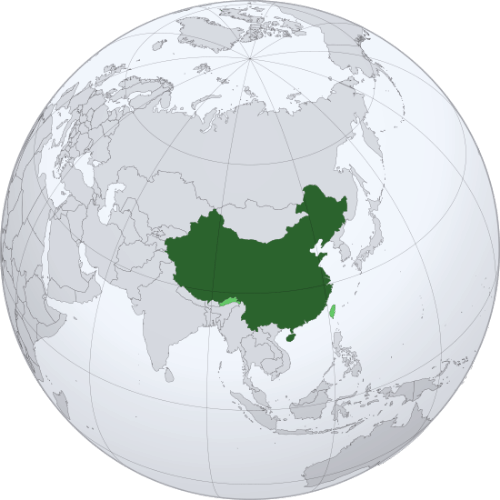
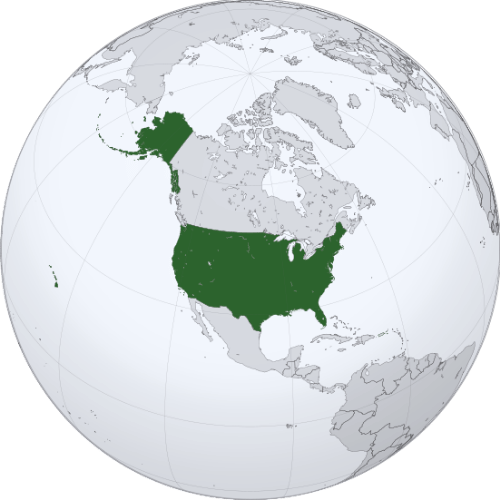
Continent  | Asia | North America |
Landlocked Status  | Not Landlocked | Not Landlocked |
Capital City  | Beijing | Washington, D.C. |
Latitude  | 35° 0′ 0″ N | 37° 45′ 0″ N |
Longitude  | 105° 0′ 0″ E | 97° 0′ 0″ W |
The total area of China is 9,596,961 sq km, and the total area of United States is 3,796,742 sq km. China is bigger than United States by 5,800,219 sq km. China is around 2.53 times bigger than United States.
Indicators | China | United States |
|---|---|---|
Area in Square Kilometers  | 9,596,961 Sq km | 3,796,742 Sq km |
| Difference | [ 5,800,219 Square Kilometers] | |
Area in Square Mile  | 3,705,407 Sq Mile | 9,833,520 Sq Mile |
| Difference | [ 6,128,113 Square Mile] | |
Water % in Area  | 2.8 % | 7.0 % |
Indicators | China | United States |
|---|---|---|
Largest City  | Chongqing, Shanghai(By Population) | New York City |
Demonyms  | Chinese | American |
Official Languages  | Standard Chinese | None |
Government Status  | Unitary Marxist-Leninist one-party socialist republic | Federal presidential republic |
Major Religion  | Buddhism | Christianity |
Major Religion Percentage  | 33.4 % | 67 % |
The people of China are called Chinese, and the people of United States are called American.
Indicators | China | United States |
|---|---|---|
Currency Name  | Renminbi | United States Dollar |
Currency Symbol  | CNY | USD |
Driving Side  | Right | Right |
Calling Code  | +86 | +1 |
Internet TLD  | .cn | .us |
Start of Week  | Monday | Sunday |
ISO 3166 Code  | CN | US |
Indicators | China | United States |
|---|---|---|
National Anthem Title (Native)  | 义勇军进行曲 (Yìyǒngjūn Jìnxíngqǔ) | The Star-Spangled Banner |
National Anthem Title (In English)  | March of the Volunteers | The Star-Spangled Banner |
National Animal  | Giant Panda | Bald Eagle |
National Bird  | Red-crowned Crane | Bald Eagle |
National Flower  | Plum Blossom | Rose |
National Sport  | Table Tennis | Baseball |
National Colors  | Red and yellow | Red, white and blue |
Indicators | China | United States |
|---|---|---|
Current Date  | Wednesday, 16th April, 2025 | Yet to Update |
Current Time  | 03:56 AM | Yet to Update |
Timezones  | UTC+8 (China Standard Time) | UTC-4 to -12, +10, +11 UTC-4 to -10 |
Current Timezone  | UTC+8 (China Standard Time) | UTC-4 to -12, +10, +11 |
Daylight Saving Time | DST Not Observed | DST Observed |
Daylight Saving Time Start  | DST Not Observed | Sunday, 10th March, 2024 |
Daylight Saving Time End  | DST Not Observed | Sunday, 3rd November, 2024 |
Daylight Saving Time Duration  | DST Not Observed | 239 days |
The current time and date in China is [03:56 AM], [Wednesday, 16th April, 2025 ].
Based on the elaboration of latest World Bank Data, the total population of China as of 2023 is estimated to be around 1,410,710,000, and the total population of United States as of 2023 is estimated to be around 334,914,895.
As per the above data, we can say that in the year 2023, China had 1,075,795,105 more people than United States.
The annual Population Growth in China is 0.34% and the annual population growth in United States is 0.58%.
Indicators | China | United States |
|---|---|---|
Age ( 0 - 14 ) (Year: 2023)  | 11.9 % | 13.9 % |
Age ( 15 - 64 ) (Year: 2023)  | 75.4 % | 71 % |
Age ( 65+ ) (Year: 2023)  | 12.7 % | 15.2 % |
Indicators | China | United States |
|---|---|---|
| [ LATEST WEATHER DATA ] | ||
Place  | Beijing | Yet to Update |
Current Time | 03:56 AM | Yet to Update |
Current Weather  | Overcast Clouds | Yet to Update |
Current Temperature  | 13.94 Degree Celsius | Yet to Update |
Wind Speed  | 3.21 km/hr, 71 Degree | Yet to Update |
Humidity  | 34 % | Yet to Update |
Indicators | China | United States |
|---|---|---|
Fertility Rate (2023)  | 1.18 (Births Per Woman) | 1.67 (Births Per Woman) |
Mortality Rate (Adult Male) (2023)  | 104.07 (Per 1000 Male Adults) | 180.76 (Per 1000 Male Adults) |
Mortality Rate (Adult Female) (2023) | 53.89 (Per 1000 Female Adults) | 103.77 (Per 1000 Female Adults) |
Infant Mortality Rate (2023)  | 4.8 (Per 1000 Live Births) | 5.4 (Per 1000 Live Births) |
Indicators | China | United States |
|---|---|---|
Top Cause of Death (2023)  | Stroke (142 people per 100K population) | Ischaemic heart disease (153 people per 100K population) |
Lowest Cause of Death (2023)  | Oesophagus cancer ( 17 people per 100K population) | Diabetes mellitus ( 19 people per 100K population) |
Road Traffic Deaths (2023)  | 17.4 (people per 100K population) | 14.2 (people per 100K population) |
Suicide Deaths (2023)  | 8.07 (Number of suicide deaths per 100K people) | 16.14 (Number of suicide deaths per 100K people) |
New HIV Infections (2023)  | Yet to Update | Yet to Update |
The leading cause of death in China, is [ Stroke ]. Around 142 people per 100,000 people in China, are dying of Stroke.
Similarly, around 153 people per 100,000 people in United States, are dying of Ischaemic heart disease, as it is the leading cause of death in there.
The government of China, spent [ 5.38% ] of the amount of the Gross Domestic Product (GDP) in health sectors in the year 2023.
Likewise, the government of United States, spent [ 17.36% ] of the amount of the Gross Domestic Product (GDP) in health sectors in the year 2023.
Indicators | China | United States |
|---|---|---|
Prevalance Of Hypertension (2023)  | 27.3 (Percentage of adults [30-79] with hypertension) | 31.6 (Percentage of adults [30-79] with hypertension) |
Adult Obesity (2023)  | 8.28% (Percentage of Obesity in adults) | 42% (Percentage of Obesity in adults) |
Pure Alcohol Consumption (2023)  | 5.73 Liters (per adult over a calendar year) | 9.57 Liters (per adult over a calendar year) |
Tobacco Consumption (2023)  | 20% (Used by people aged 15 and above) | 20% (Used by people aged 15 and above) |
As per the data from the World Health Organization (WHO), people living in China, are 5.07 times less likely to be obese compared to the people living in United States.
We hope you enjoyed the detailed guide on the general comparison between China and United States.
For more side-by-side comparsion between Countries, States and Cities, you can use the search box above or click the links below.
The Comparedoo.com family sincerely appreciates your time with us. We look forward to seeing you on our other pages.