

Published: Monday, 21th October 2024
Comparedoo.com welcomes you to explore the detailed comparison between Ethiopia and Zimbabwe.
Dive in and compare them across different aspects like cost of living, standard of living, geography, demographics, environment, society, economy, health factors and many more.
Enjoy exploring!


 Indicators  | Ethiopia  | Zimbabwe  |
|---|---|---|
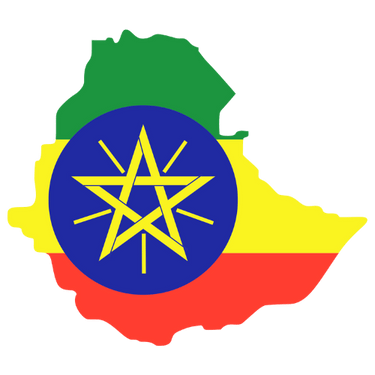
Official Name  | Federal Democratic Republic of Ethiopia | Republic of Zimbabwe |
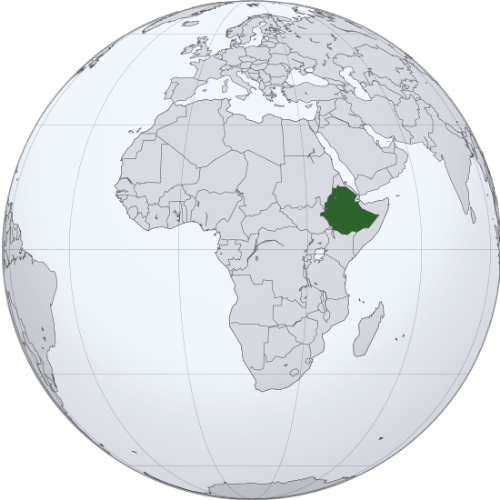
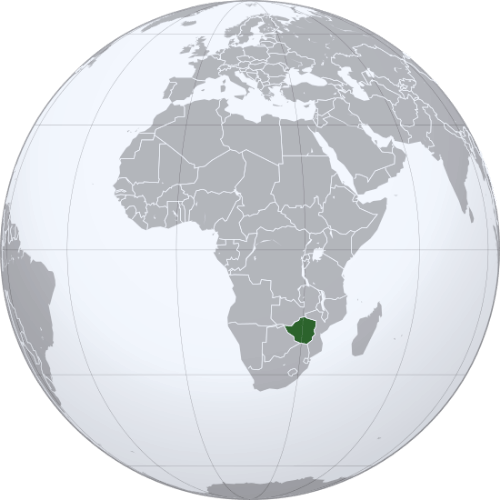
Continent  | Africa | Africa |
Landlocked Status  | Landlocked | Landlocked |
Capital City  | Addis Ababa | Harare |
Latitude  | 9° 0′ 0″ N | 20° 0′ 0″ S |
Longitude  | 38° 0′ 0″ E | 29° 0′ 0″ E |
The total area of Ethiopia is 1,112,000 sq km, and the total area of Zimbabwe is 390,757 sq km. Ethiopia is bigger than Zimbabwe by 721,243 sq km. Ethiopia is around 2.85 times bigger than Zimbabwe.
Indicators | Ethiopia | Zimbabwe |
|---|---|---|
Area in Square Kilometers  | 1,112,000 Sq km | 390,757 Sq km |
| Difference | [ 721,243 Square Kilometers] | |
Area in Square Mile  | 429,000 Sq Mile | 150,872 Sq Mile |
| Difference | [ 278,128 Square Mile] | |
Water % in Area  | 0.7 % | 1 % |
Indicators | Ethiopia | Zimbabwe |
|---|---|---|
Largest City  | Addis Ababa | Harare |
Demonyms  | Ethiopian | Zimbabwean |
Official Languages  | Amharic, Afar, Oromo, Somali, Tigrinya | English, Shona, Sindebele and 13 others |
Government Status  | Federal parliamentary republic | Unitary presidential republic |
Major Religion  | Christianity | Christianity |
Major Religion Percentage  | 67.3 % | 84.1 % |
The people of Ethiopia are called Ethiopian, and the people of Zimbabwe are called Zimbabwean.
Indicators | Ethiopia | Zimbabwe |
|---|---|---|
Currency Name  | Ethiopian birr | Zimbabwe Gold, United States Dollar, South African rand |
Currency Symbol  | ETB | ZWL |
Driving Side  | Right | Left |
Calling Code  | +251 | +263 |
Internet TLD  | .et | .zw |
Start of Week  | Monday | Monday |
ISO 3166 Code  | ET | ZW |
Indicators | Ethiopia | Zimbabwe |
|---|---|---|
National Anthem Title (Native)  | ዘመነ ሰላም (Zemenā Selām) | Simudzai Mureza wedu WeZimbabwe |
National Anthem Title (In English)  | March Forward, Dear Mother Ethiopia | Blessed be the Land of Zimbabwe |
National Animal  | Lion | Sable Antelope |
National Bird  | Abyssinian Catbird | African Fish Eagle |
National Flower  | Calla lily | Gloriosa Superba |
National Sport  | Football | Football |
National Colors  | Green, yellow, red and blue | Green, yellow, red, black and white |
Indicators | Ethiopia | Zimbabwe |
|---|---|---|
Current Date  | Yet to Update | Yet to Update |
Current Time  | Yet to Update | Yet to Update |
Timezones  | UTC+3 (East Africa Time) | UTC+2 (Central Africa Time) |
Current Timezone  | UTC+3 (East Africa Time) | UTC+2 (Central Africa Time) |
Daylight Saving Time | DST Not Observed | DST Not Observed |
Daylight Saving Time Start  | DST Not Observed | DST Not Observed |
Daylight Saving Time End  | DST Not Observed | DST Not Observed |
Daylight Saving Time Duration  | DST Not Observed | DST Not Observed |
Based on the elaboration of latest World Bank Data, the total population of Ethiopia as of 2023 is estimated to be around 126,527,060, and the total population of Zimbabwe as of 2023 is estimated to be around 16,665,409.
As per the above data, we can say that in the year 2023, Ethiopia had 109,861,651 more people than Zimbabwe.
The annual Population Growth in Ethiopia is 2.68% and the annual population growth in Zimbabwe is 2.09%.
Indicators | Ethiopia | Zimbabwe |
|---|---|---|
Age ( 0 - 14 ) (Year: 2023)  | 26.8 % | 27.1 % |
Age ( 15 - 64 ) (Year: 2023)  | 70.1 % | 69.8 % |
Age ( 65+ ) (Year: 2023)  | 3.02 % | 3.15 % |
Indicators | Ethiopia | Zimbabwe |
|---|---|---|
| [ LATEST WEATHER DATA ] | ||
Place  | Yet to Update | Yet to Update |
Current Time | Yet to Update | Yet to Update |
Current Weather  | Yet to Update | Yet to Update |
Current Temperature  | Yet to Update | Yet to Update |
Wind Speed  | Yet to Update | Yet to Update |
Humidity  | Yet to Update | Yet to Update |
Indicators | Ethiopia | Zimbabwe |
|---|---|---|
Fertility Rate (2023)  | 4.06 (Births Per Woman) | 3.44 (Births Per Woman) |
Mortality Rate (Adult Male) (2023)  | 268.21 (Per 1000 Male Adults) | 449.36 (Per 1000 Male Adults) |
Mortality Rate (Adult Female) (2023) | 170.58 (Per 1000 Female Adults) | 325.39 (Per 1000 Female Adults) |
Infant Mortality Rate (2023)  | 33.9 (Per 1000 Live Births) | 34.6 (Per 1000 Live Births) |
Indicators | Ethiopia | Zimbabwe |
|---|---|---|
Top Cause of Death (2023)  | Neonatal conditions (70.8 people per 100K population) | HIV/AIDS (137 people per 100K population) |
Lowest Cause of Death (2023)  | Congenital anomalies ( 14 people per 100K population) | Congenital anomalies ( 15 people per 100K population) |
Road Traffic Deaths (2023)  | 17.7 (people per 100K population) | 29.9 (people per 100K population) |
Suicide Deaths (2023)  | 5.38 (Number of suicide deaths per 100K people) | 14.12 (Number of suicide deaths per 100K people) |
New HIV Infections (2023)  | 0.08 (HIV infections per 1000 people) | 1.12 (HIV infections per 1000 people) |
The leading cause of death in Ethiopia, is [ Neonatal conditions ]. Around 70.8 people per 100,000 people in Ethiopia, are dying of Neonatal conditions.
Similarly, around 137 people per 100,000 people in Zimbabwe, are dying of HIV/AIDS, as it is the leading cause of death in there.
The government of Ethiopia, spent [ 3.21% ] of the amount of the Gross Domestic Product (GDP) in health sectors in the year 2023.
Likewise, the government of Zimbabwe, spent [ 2.79% ] of the amount of the Gross Domestic Product (GDP) in health sectors in the year 2023.
Indicators | Ethiopia | Zimbabwe |
|---|---|---|
Prevalance Of Hypertension (2023)  | 27.4 (Percentage of adults [30-79] with hypertension) | 42.3 (Percentage of adults [30-79] with hypertension) |
Adult Obesity (2023)  | 2.82% (Percentage of Obesity in adults) | 14.2% (Percentage of Obesity in adults) |
Pure Alcohol Consumption (2023)  | 3.36 Liters (per adult over a calendar year) | 3.63 Liters (per adult over a calendar year) |
Tobacco Consumption (2023)  | 5% (Used by people aged 15 and above) | 10% (Used by people aged 15 and above) |
As per the data from the World Health Organization (WHO), people living in Ethiopia, are 5.04 times less likely to be obese compared to the people living in Zimbabwe.
We hope you enjoyed the detailed guide on the general comparison between Ethiopia and Zimbabwe.
For more side-by-side comparsion between Countries, States and Cities, you can use the search box above or click the links below.
The Comparedoo.com family sincerely appreciates your time with us. We look forward to seeing you on our other pages.