
Published: Monday, 21th October 2024
Comparedoo.com welcomes you to explore the detailed comparison between South Africa and Namibia.
Dive in and compare them across different aspects like cost of living, standard of living, geography, demographics, environment, society, economy, health factors and many more.
Enjoy exploring!
 Indicators  | South Africa  | Namibia  |
|---|---|---|
Official Name  | Republic of South Africa | Republic of Namibia |
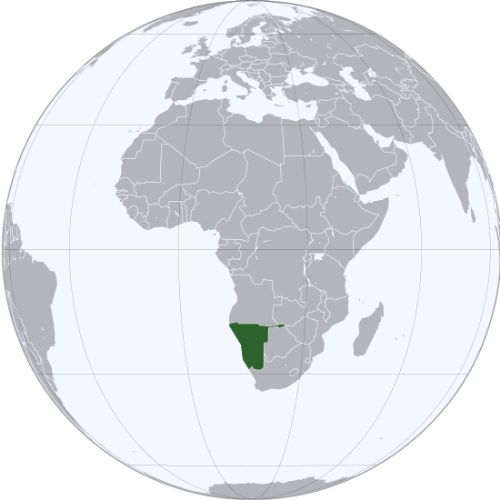
Continent  | Africa | Africa |
Landlocked Status  | Not Landlocked | Not Landlocked |
Capital City  | Pretoria, Cape Town, Bloemfontein | Windhoek |
Latitude  | 30° 0′ 0″ S | 22° 0′ 0″ S |
Longitude  | 25° 0′ 0″ E | 17° 0′ 0″ E |
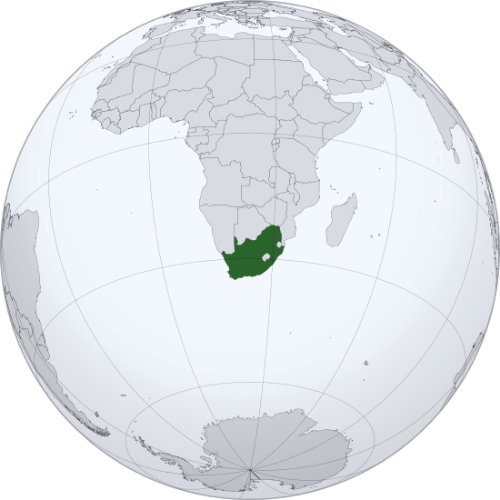
The total area of South Africa is 1,221,037 sq km, and the total area of Namibia is 825,615 sq km. South Africa is bigger than Namibia by 395,422 sq km. South Africa is around 1.48 times bigger than Namibia.
Indicators | South Africa | Namibia |
|---|---|---|
Area in Square Kilometers  | 1,221,037 Sq km | 825,615 Sq km |
| Difference | [ 395,422 Square Kilometers] | |
Area in Square Mile  | 471,445 Sq Mile | 318,772 Sq Mile |
| Difference | [ 152,673 Square Mile] | |
Water % in Area  | 0.380 % | Negligible |
Indicators | South Africa | Namibia |
|---|---|---|
Largest City  | Johannesburg | Windhoek |
Demonyms  | South African | Namibian |
Official Languages  | Afrikaans, English, and 10 others | English |
Government Status  | Unitary parliamentary republic with an executive presidency | Unitary semi-presidential republic |
Major Religion  | Christianity | Christianity |
Major Religion Percentage  | 78 % | 87.9 % |
The people of South Africa are called South African, and the people of Namibia are called Namibian.
Indicators | South Africa | Namibia |
|---|---|---|
Currency Name  | South African rand | Namibian dollar |
Currency Symbol  | ZAR | NAD |
Driving Side  | Left | Left |
Calling Code  | +27 | +264 |
Internet TLD  | .za | .na |
Start of Week  | Monday | Monday |
ISO 3166 Code  | ZA | NA |
Indicators | South Africa | Namibia |
|---|---|---|
National Anthem Title (Native)  | Nkosi Sikelel' iAfrika | Namibia, Land of the Brave |
National Anthem Title (In English)  | National anthem of South Africa | Namibia, Land of the Brave |
National Animal  | Springbok | Oryx |
National Bird  | Blue Crane | African Fish Eagle |
National Flower  | King Protea | Welwitschia Mirabilis |
National Sport  | Rugby Union | Rugby Union |
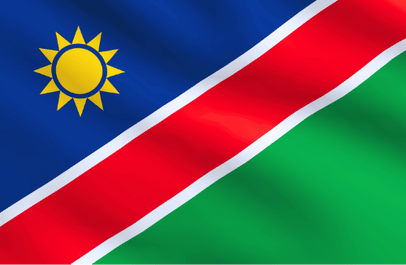
National Colors  | Red, green, blue, gold, black and white | Blue, red, green, white and yellow |
Indicators | South Africa | Namibia |
|---|---|---|
Current Date  | Monday, 7th April, 2025 | Monday, 7th April, 2025 |
Current Time  | 05:07 AM | 05:07 AM |
Timezones  | UTC+2 (South Africa Standard Time) | UTC+2 (Central Africa Time) |
Current Timezone  | UTC+2 (South Africa Standard Time) | UTC+2 (Central Africa Time) |
Daylight Saving Time | DST Not Observed | DST Not Observed |
Daylight Saving Time Start  | DST Not Observed | DST Not Observed |
Daylight Saving Time End  | DST Not Observed | DST Not Observed |
Daylight Saving Time Duration  | DST Not Observed | DST Not Observed |
The current time and date in South Africa is [05:07 AM], [Monday, 7th April, 2025 ].
The current time and date in Namibia is [05:07 AM], [Monday, 7th April, 2025].
So the current time and date in South Africa and Namibia are same.
Based on the elaboration of latest World Bank Data, the total population of South Africa as of 2023 is estimated to be around 60,414,495, and the total population of Namibia as of 2023 is estimated to be around 2,604,172.
As per the above data, we can say that in the year 2023, South Africa had 57,810,323 more people than Namibia.
The annual Population Growth in South Africa is 1.15% and the annual population growth in Namibia is 1.68%.
Indicators | South Africa | Namibia |
|---|---|---|
Age ( 0 - 14 ) (Year: 2023)  | 19.5 % | 24.1 % |
Age ( 15 - 64 ) (Year: 2023)  | 75.1 % | 72.1 % |
Age ( 65+ ) (Year: 2023)  | 5.44 % | 3.74 % |
Indicators | South Africa | Namibia |
|---|---|---|
| [ LATEST WEATHER DATA ] | ||
Place  | Pretoria | Windhoek |
Current Time | 05:07 AM | 05:07 AM |
Current Weather  | Overcast Clouds | Light Rain |
Current Temperature  | 16.98 Degree Celsius | 17.28 Degree Celsius |
Wind Speed  | 2.8 km/hr, 47 Degree | 1.03 km/hr, 350 Degree |
Humidity  | 99 % | 95 % |
Indicators | South Africa | Namibia |
|---|---|---|
Fertility Rate (2023)  | 2.34 (Births Per Woman) | 3.25 (Births Per Woman) |
Mortality Rate (Adult Male) (2023)  | 416.31 (Per 1000 Male Adults) | 521.27 (Per 1000 Male Adults) |
Mortality Rate (Adult Female) (2023) | 307.78 (Per 1000 Female Adults) | 348.11 (Per 1000 Female Adults) |
Infant Mortality Rate (2023)  | 27.7 (Per 1000 Live Births) | 28.6 (Per 1000 Live Births) |
Indicators | South Africa | Namibia |
|---|---|---|
Top Cause of Death (2023)  | HIV/AIDS (122.9 people per 100K population) | HIV/AIDS (117.4 people per 100K population) |
Lowest Cause of Death (2023)  | Self-harm ( 23.5 people per 100K population) | Chronic obstructive pulmonary disease ( 18.5 people per 100K population) |
Road Traffic Deaths (2023)  | 24.5 (people per 100K population) | 22 (people per 100K population) |
Suicide Deaths (2023)  | 2019 (Number of suicide deaths per 100K people) | 9.73 (Number of suicide deaths per 100K people) |
New HIV Infections (2023)  | 3.15 (HIV infections per 1000 people) | 2.39 (HIV infections per 1000 people) |
The leading cause of death in South Africa, is [ HIV/AIDS ]. Around 122.9 people per 100,000 people in South Africa, are dying of HIV/AIDS.
Similarly, around 117.4 people per 100,000 people in Namibia, are dying of HIV/AIDS, as it is the leading cause of death in there.
The government of South Africa, spent [ 8.27% ] of the amount of the Gross Domestic Product (GDP) in health sectors in the year 2023.
Likewise, the government of Namibia, spent [ 9.38% ] of the amount of the Gross Domestic Product (GDP) in health sectors in the year 2023.
Indicators | South Africa | Namibia |
|---|---|---|
Prevalance Of Hypertension (2023)  | 44.1 (Percentage of adults [30-79] with hypertension) | 43.8 (Percentage of adults [30-79] with hypertension) |
Adult Obesity (2023)  | 30.8% (Percentage of Obesity in adults) | 17% (Percentage of Obesity in adults) |
Pure Alcohol Consumption (2023)  | 8.77 Liters (per adult over a calendar year) | 5.93 Liters (per adult over a calendar year) |
Tobacco Consumption (2023)  | 20% (Used by people aged 15 and above) | 10% (Used by people aged 15 and above) |
As per the data from the World Health Organization (WHO), people living in South Africa, are 1.81 times more likely to be obese compared to the people living in Namibia.
We hope you enjoyed the detailed guide on the general comparison between South Africa and Namibia.
For more side-by-side comparsion between Countries, States and Cities, you can use the search box above or click the links below.
The Comparedoo.com family sincerely appreciates your time with us. We look forward to seeing you on our other pages.